The Problem: How Antibody Failure Can Derail Years of Research
Antibody discontinuation and lot-to-lot variability are common causes of assay disruption and irreproducibility in biomarker research.
-
Scenario 1: Antibody discontinued. When a trusted antibody became unavailable.
-
Scenario 2: New lot fails In 2006, Yale pathologist David Rimm developed a promising antibody-based melanoma test supported by over $2 million funding. Three years later, a new batch of antibodies from the same supplier failed to work.
Months or years of assay optimization are at risk due to decisions or supply changes outside your control.
See how one neuroscience team used FOPPR (Fiber-Optic Particle Plasmon Resonance) kinetic screening and FONLISA (Fiber-Optic Nanoparticle-Linked Immunosorbent Assay) ultrasensitive detection to identify and validate a replacement antibody pair in days, not months.
What a Replacement Workflow Must Solve
A replacement workflow must rapidly identify candidates with equal or better assay performance.
| Challenge | Solution |
|---|---|
| Affinity drops or weak signal | Real-time measurement of ka, kd, and KD across all candidates. Not just yes/no binding. |
| Epitope Incompatibility | Identification of non-competing antibody pairs suitable for sandwich assay formation. |
| Tedious optimization delays research. | Rapid candidate selection without regeneration or optimization steps. |
Replace cumbersome trial-and-error troubleshooting with a faster, kinetics-guided validation workflow on a compact, easy-to-use platform.
Step 1. Screen: Affinity Analysis to Find Top Candidates
Technical Background
FOPPR enables rapid screening of commercial NfL antibodies by measuring real-time binding kinetics without repeated regeneration steps or extensive optimization to minimize mass transport limitation, analyte retention, and rebinding effects.
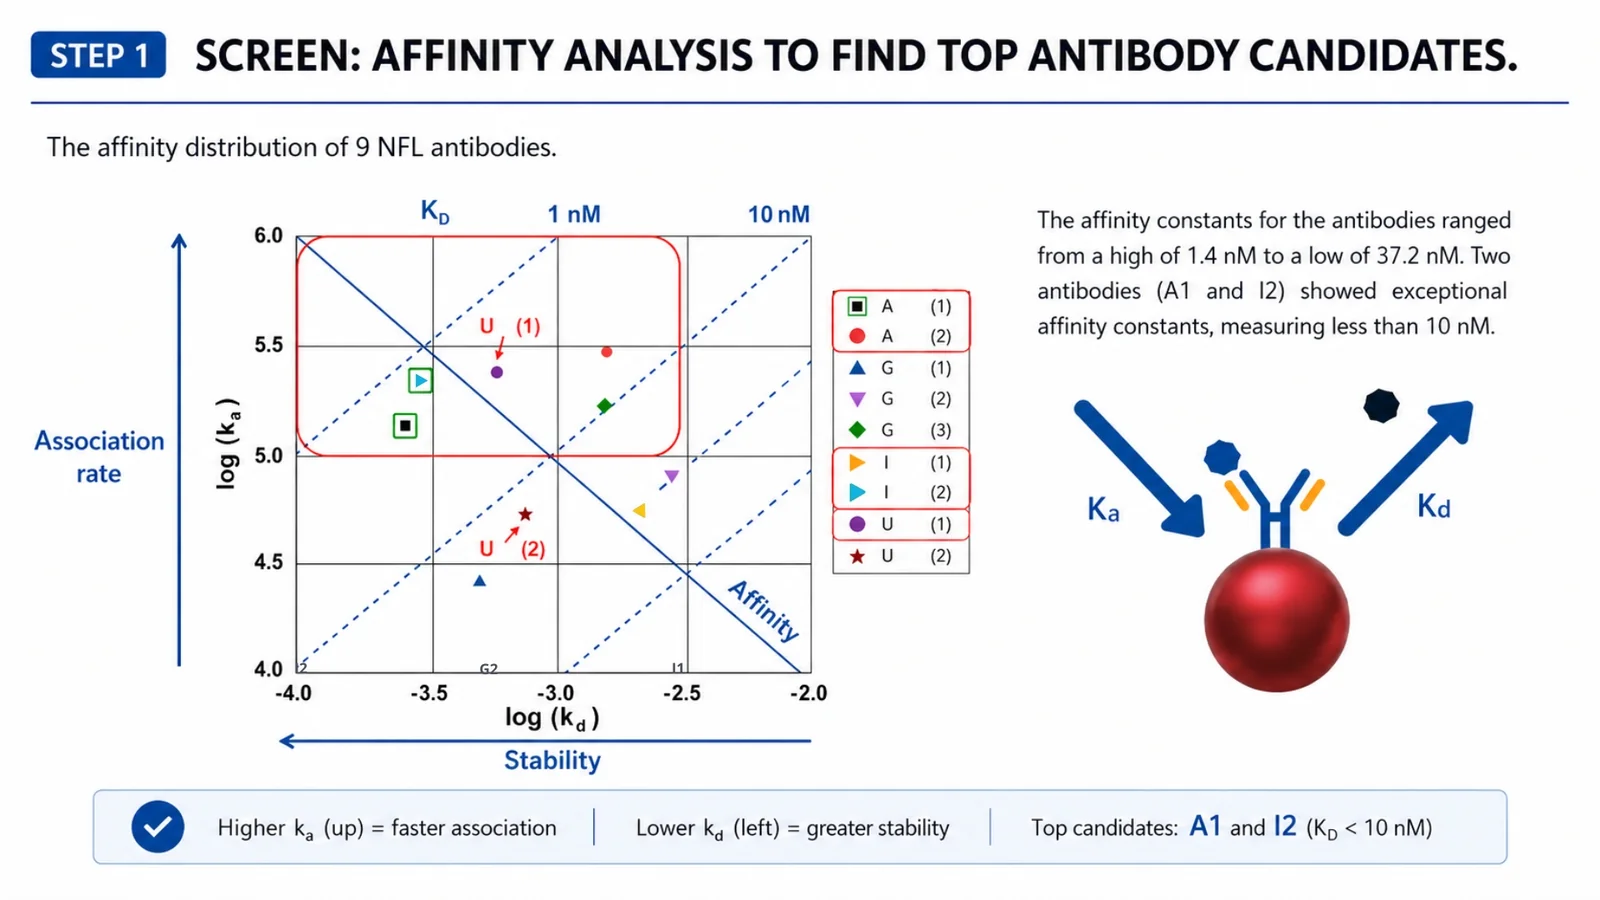
For each candidate, FOPPR measures the association rate constant (ka), dissociation rate constant (kd), and equilibrium dissociation constant (KD = kd/ka). These parameters help distinguish antibodies that bind strongly and remain stable from those that produce signal but dissociate quickly.
Experimental Procedure & Data
Nine commercial NfL antibodies were screened to compare their binding affinity for NfL. Their KD values ranged from 1.4 nM to 37.2 nM, where a lower KD indicates stronger overall binding affinity. Two antibodies, A(1) and I(2), showed KD values below 10 nM (1.96 nM and 1.4 nM, respectively), making them primary candidates for epitope binning to determine whether they could work together as a sandwich antibody pair.
Real-time measurement captures the full binding behavior of an interaction: how fast the complex forms, how tightly it binds, and how long it remains associated. Unlike endpoint assays, which provide only a snapshot after incubation and wash steps, real-time methods continuously monitor association and dissociation. This reduces the risk that fast-dissociating binders will be misinterpreted as false negatives.
Step 2. Select: Epitope Binning to Identify the Best Antibody Pair
Technical Background
High affinity shows that an antibody binds strongly to the target, but it does not tell us whether two antibodies can bind the target at the same time.
For a sandwich assay, the capture and detection antibodies must recognize distinct, accessible epitopes. If two antibodies bind the same or overlapping epitope, they compete. Even when epitopes are different, one antibody can physically block the other if the sites are too close, a phenomenon known as steric hindrance.
Therefore, affinity alone is not sufficient. Epitope binning is needed to identify antibody pairs that can bind simultaneously and form a functional sandwich assay.
Experimental Procedure & Data
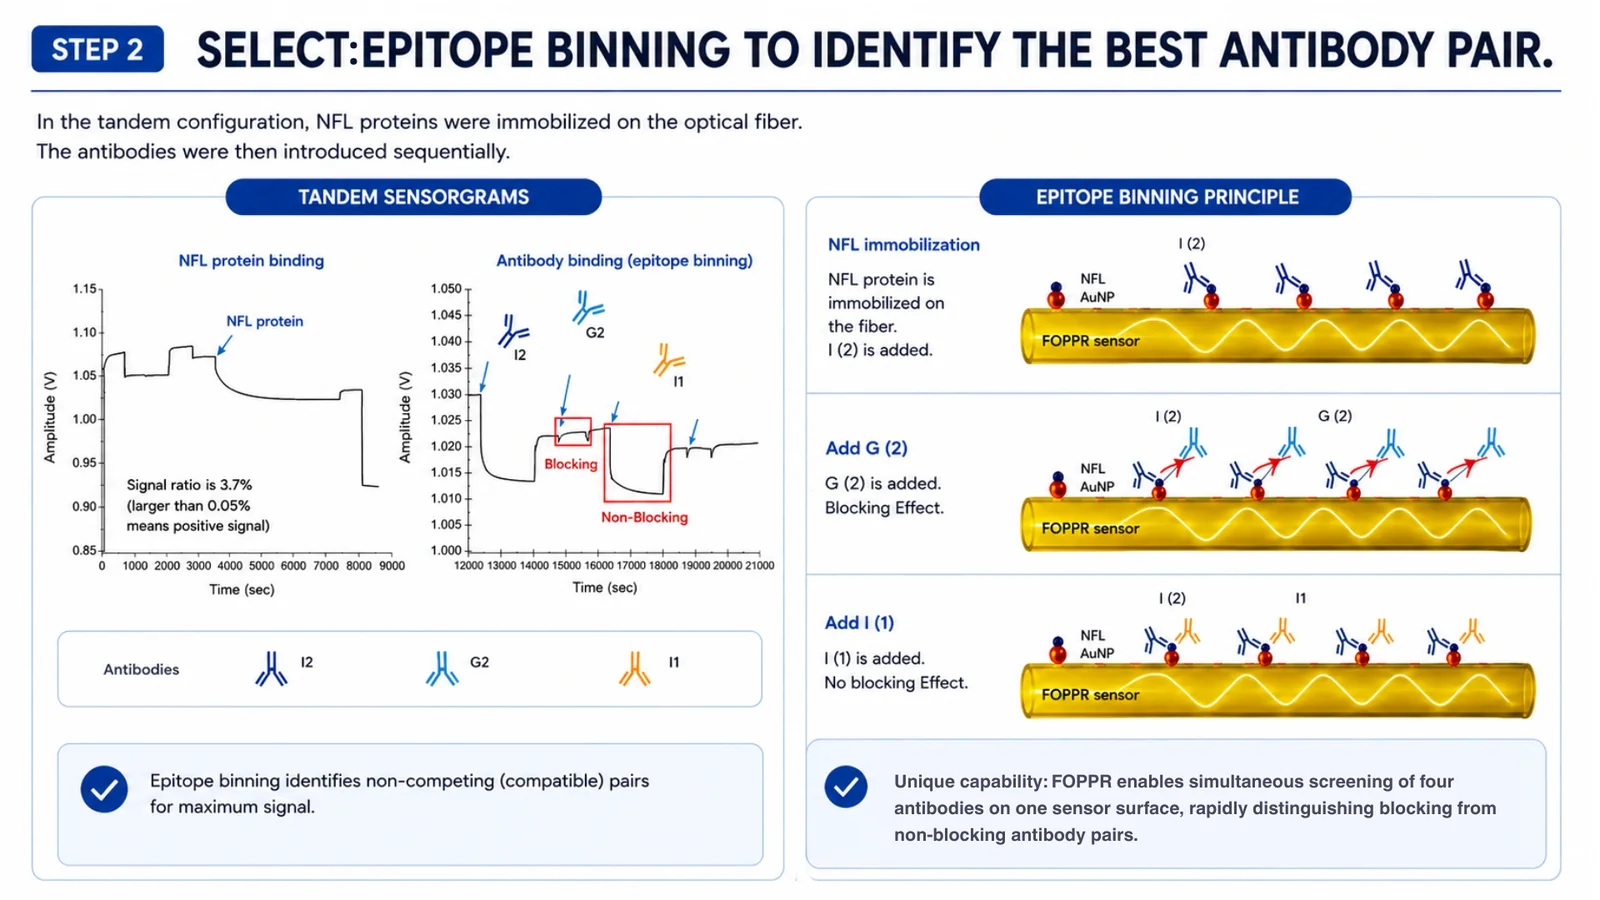
NfL protein is immobilized on the optical fiber. Up to 4 antibodies are introduced sequentially with no regeneration step between injections. The signal after each addition reveals whether the incoming antibody can still access a free epitope on the fiber-bound NfL protein, or whether it is blocked by the preceding antibody.
When G(2) was introduced after I(2) had bound, no significant signal change was observed in the sensorgram, indicating that G(2) and I(2) likely compete for the same or overlapping epitope on NfL.
When I(1) was introduced after I(2) had bound, the decrease in signal suggested that I(1) was able to bind after I(2), indicating that the two antibodies bind to non-competing sites on NfL. A(1) was evaluated against I(2) through the same process (data not shown).
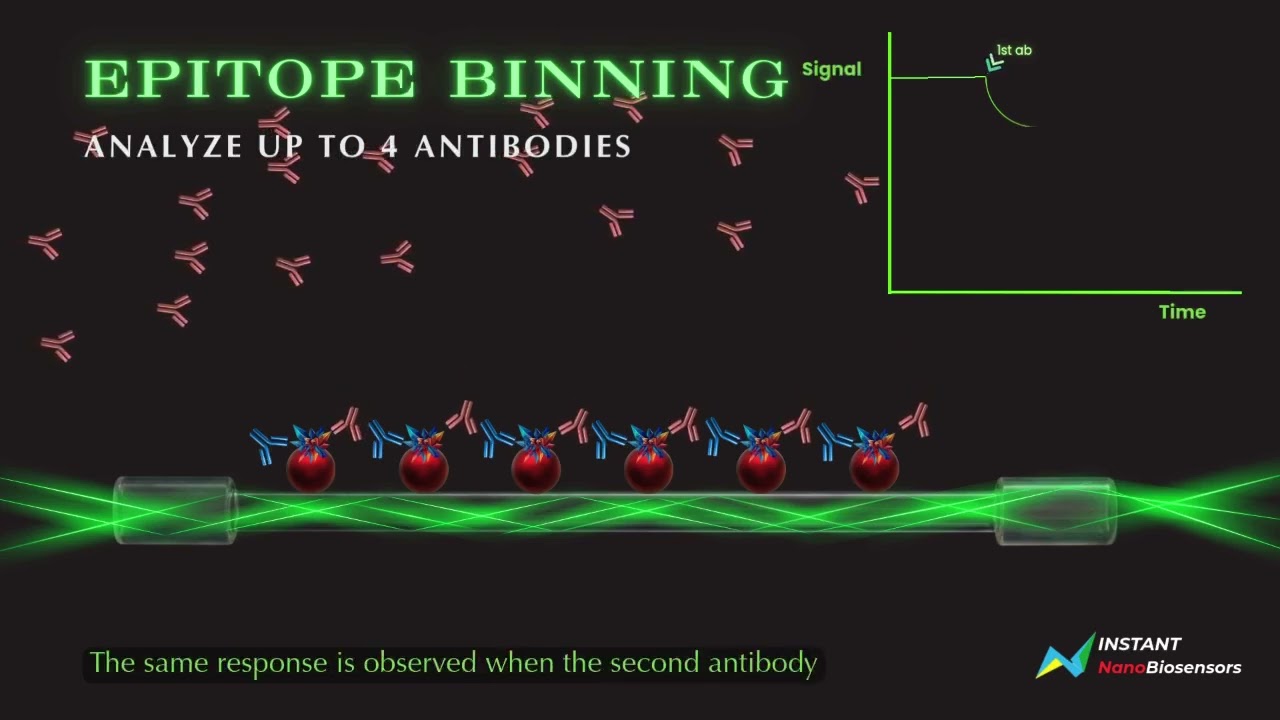
FOPPR can sequentially introduce up to four antibodies onto the same target surface to rapidly assess epitope compatibility without regeneration between antibody injections.
A signal decrease suggests that the added antibody recognizes an available, non-competing epitope. A reduced or absent signal change suggests competition, epitope overlap, or steric hindrance.
Step 3. Detect & Compare: Use the Selected Pair for Ultra-Sensitive Detection
Technical Background
With the I(2) + A(1) pair confirmed as both high-affinity and epitope-compatible, the final step is validating detection performance using FONLISA and comparing results against SIMOA.
The capture antibody is immobilized on an uncladded glass fiber surface. When NfL is present in the serum sample, it binds the capture antibody and subsequently recruits the detection antibody, which is conjugated to a gold nanoparticle (AuNP). The AuNP sandwich complex enters the evanescent field generated at the fiber surface as light propagates by multiple total internal reflections. The AuNP absorbs light in proportion to the analyte concentration, generating a quantifiable signal drop at the fiber output with near-zero background.
Preliminary Clinical-Sample Evaluation
FONLISA was evaluated in two cohorts: healthy controls (n = 8) and patients with elevated serum NfL (n = 8).
Both FONLISA and SIMOA detected statistically significant differences between the control and patient groups:
- SIMOA: p = 0.0002
- FONLISA: p = 0.0009
Less than 20 µL of serum was used per FONLISA run.
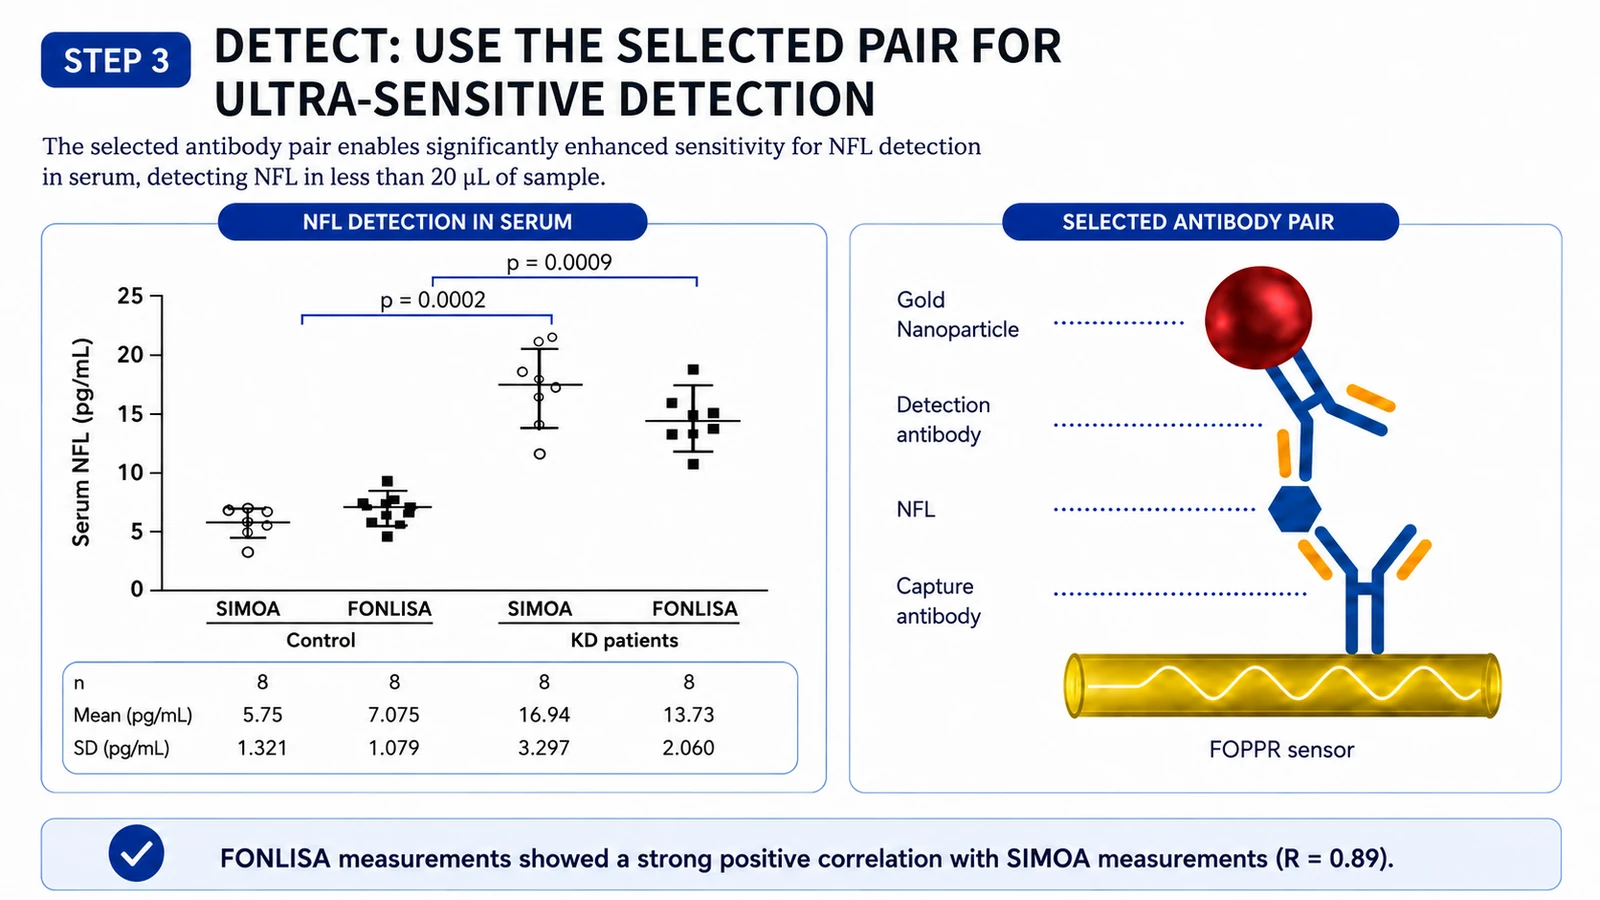
The I(2) + A(1) pair was validated as a functional replacement for the discontinued NfL antibody. FONLISA results showed strong correlation with SIMOA measurements in the tested samples while using less than 20 µL of serum. Assay rebuilt in days, not months.
Validate: Peer-Reviewed Evidence in Human Plasma
| Result | Metric |
|---|---|
| 0.8 pg/mL | Limit of Quantitation |
| R = 0.99 | Correlation with SIMOA |
| 44 patient samples | Real-Plasma Evaluation |
| p < 0.0001 | Significant Group Difference |
In a separate peer-reviewed proof-of-concept study, researchers from Stanford University School of Medicine, Stanford Health Care, and Instant NanoBiosensors developed and evaluated a FOPPR-based assay for measuring neurofilament light chain (NfL) in human plasma. The study assessed analytical sensitivity, precision, agreement with SIMOA, and performance in remnant plasma samples from patients with type 2 diabetes, with and without diabetic neuropathy.
Analytical sensitivity and precision
The FOPPR NfL assay achieved a limit of quantitation of 0.8 pg/mL and an analytical measurement range of 0.8–200.4 pg/mL. Precision remained below 10% CV across all tested concentrations, including 8.6% at the LOQ, demonstrating consistent within-run and between-run reproducibility across the assay range.
Agreement with SIMOA
A 34-sample method comparison included 20 human plasma samples and 14 plasma samples spiked with recombinant NfL. FOPPR showed strong agreement with a SIMOA NfL assay, with:
- a correlation coefficient of 0.99;
- a regression slope of 1.0;
- a mean bias of −2.0 pg/mL.
Evaluation in patient plasma
The assay was subsequently applied to 44 remnant plasma samples from patients with type 2 diabetes.
Median plasma NfL concentrations were:
- 20.1 pg/mL in patients with diabetic neuropathy;
- 10.9 pg/mL in patients without diabetic neuropathy.
The difference between the groups was statistically significant at p < 0.0001.
These findings demonstrate the ability of the FOPPR platform to progress from analytical assay development and method comparison to measurement of low-abundance biomarkers in real patient samples. They also support further investigation of plasma NfL as a biomarker associated with diabetic neuropathy.
This was a proof-of-concept research study. Larger clinical studies are required to establish reference intervals, diagnostic cutoffs, clinical utility, and intended use.
In a peer-reviewed proof-of-concept study conducted with researchers from Stanford University School of Medicine and Stanford Health Care, a FOPPR-based plasma NfL assay was evaluated in 44 remnant plasma samples from patients with type 2 diabetes. Median NfL concentrations were significantly higher in patients with diabetic neuropathy than in those without neuropathy (20.1 vs. 10.9 pg/mL; p < 0.0001).
Chen F, Yeung PS-W, Chang T-C, Chung T-C, Yen H-W, Luo RY. A fiber optic particle plasmon resonance assay for the detection of neurofilament light as a potential early biomarker for diabetic neuropathy. Clinica Chimica Acta. 2026;579:120697. View publication ↗
Struggling with antibody selection or low-abundance biomarker detection? Talk to our technical team and see how the FOPPR–FONLISA workflow could accelerate your assay development.
Request a Complimentary Technical DemoHow FOPPR Differs from Conventional SPR for Antibody Screening
The dextran matrix problem
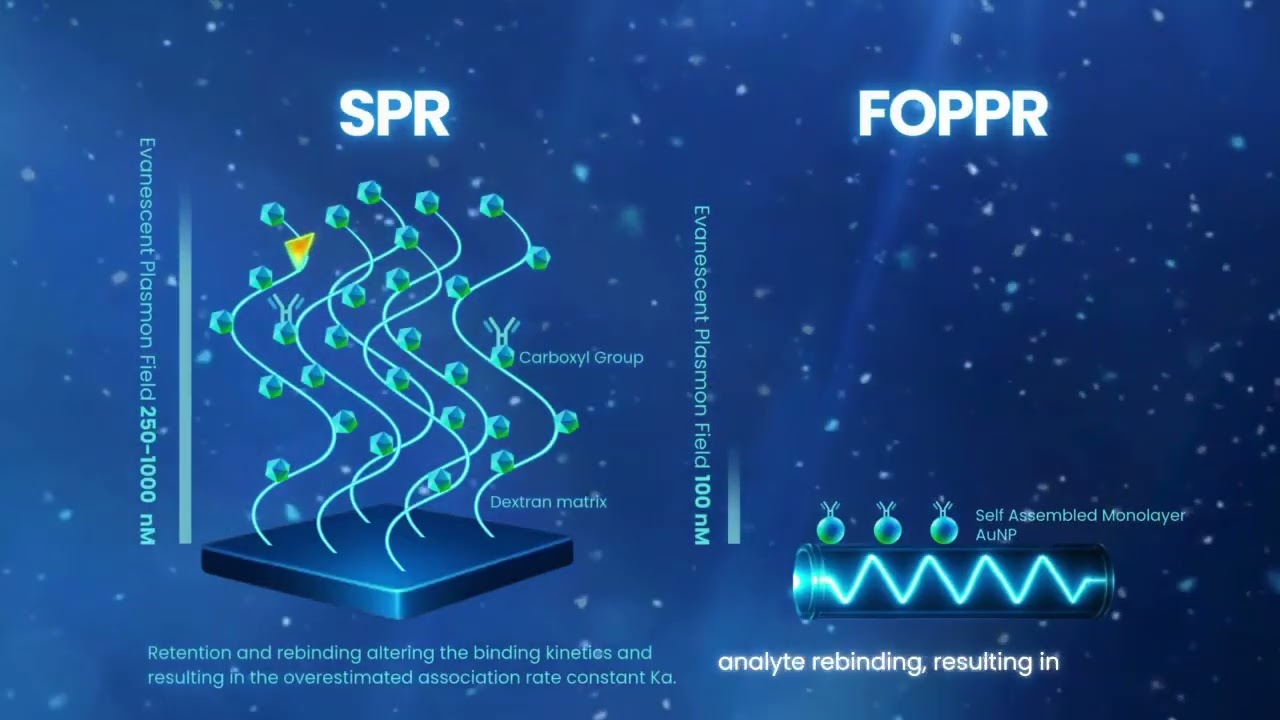
Standard SPR sensor chips typically use a thin, flat gold surface modified with a dextran matrix to create a three-dimensional binding environment. Compared with direct immobilization on a flat 2D surface, this matrix increases surface binding capacity and can improve target accessibility, helping reduce orientation-related artifacts. However, matrix-based surfaces can also contribute to analyte retention, rebinding, and mass transport limitations, requiring extensive optimization of assay conditions to obtain reliable kinetic measurements.
FOPPR's 3D design for faster kinetic screening
FOPPR uses a self-assembled gold nanoparticle monolayer on a glass fiber to create a three-dimensional sensing surface. This unobstructed architecture allows association and dissociation to occur more freely, reducing matrix-associated analyte retention and rebinding effects commonly associated with matrix-based sensor surfaces. FOPPR does not require externally driven flow. Sample delivery is driven by capillary force and gravity, creating a gentler, low-shear environment that better supports native-like binding behavior. As a result, the measured ka and kd values more closely reflect the true antibody–antigen interaction while reducing the need for extensive surface optimization or regeneration, enabling simpler and faster antibody screening.
| Technology | Sensitivity | Key Limitation | FOPPR / FONLISA Advantage |
|---|---|---|---|
| Standard ELISA | pM – nM | Endpoint assay (misses fast-dissociating antibodies); insufficient sensitivity for low-abundance targets | Real-time kinetics; fg/mL sensitivity |
| SIMOA | fM | Endpoint assay (no kinetic information); large instrument | Real-time kinetics reveal binding behaviour; compact |
| Conventional SPR | nM – pM | Requires regeneration between cycles; precision optics and mechanical pump | No regeneration between sequential antibody injections; no mechanical fluid system |
FOPPR uses an unobstructed gold nanoparticle-based 3D sensing surface with capillary- and gravity-driven sample delivery, minimizing matrix-associated artifacts, reducing the need for optimization, and enabling faster antibody screening.
See FOPPR and FONLISA in Action
Frequently Asked Questions
See the FOPPR Workflow
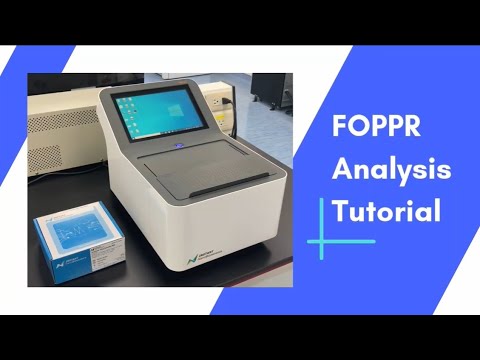
Watch a step-by-step tutorial showing the analyzer workflow and real-time measurement process.